Integrating alerts into your operational comms environment - for Teams and Slack
Integrating alerts into your operational comms environment - for Teams and Slack
The 5G SA network offers huge benefits and new revenue opportunities to operators, but with it comes a new level of complexity when it comes to service assurance. Getting alerts directly to your working environment – Teams and Slack – from your test platform boosts efficiency and helps drive optimisation and remediation activities.
A key feature of 5G SBA networks will be the dynamic orchestration of services and, importantly, network slices, which will enable operators to provide innovative new use cases and gain service differentiation. But to be successful, QoS and QoE must be tested pre-launch and monitored throughout the lifecycle of the live service or network slice.
5G SA success requires a DevOps approach, whereby service chains and slices are continually upgraded, replaced, or retired according to demand. In turn, this requires a radically new approach to service and slice service assurance. Service chains and slices will need to be comprehensively tested and validated pre-launch and, using active monitoring, throughout the active life of each service or slice. Automated tested and active monitoring will be essential.
Emulated and live active monitoring
Notably, with such a broad range of different use cases – from low-latency, high-speed, mission critical services to less demanding IoT applications – each service or slice will have unique KPI and SLA requirements. This requires emulated active monitoring during the pre-launch phase using software agents, or probes, within a test platform that can emulate UEs to test and validate that a new service provides the required QoS and QoE prior to launch. Likewise, post-launch, service levels must be optimised and maintained throughout the entire lifecycle of the service or network slice.
It means that new tools and capabilities are required to assure service levels. The ability to collect and share near-real-time data and monitor service performance on a per-service, per-device, or per-network-slice basis is essential, and automation is key.
Emblasoft’s Active Monitoring solution deploys software agents – that mimic UEs and monitor realistic ‘injected’ traffic (attuned to each service or slice) on an-going basis. It allows operators to comprehensively test KPIs and SLAs of new services and slices. Post-launch, automated, distributed probes sit in the live network interacting with delivery components to monitor service levels on a continual basis.
Emblasoft Active Monitoring offers multiple capabilities, including:
- Precise KPI measurement – per service, per user
- Dynamic agent activation, scalable to thousands
- Flexible scenario creation with pre-set libraries of test cases
- Encrypted traffic sessions
- Centralised management and control
- Integration with automation, workflows, and third-party systems.
Active monitoring real-time alerts are essential
However, one of the most important aspects of active monitoring, whether in test scenarios or in live networks, is the ability to set alarms that automatically alert users when service levels drop below a pre-defined value (for example, a specific KPI), or for a pre-defined length of time.
When running automated test programmes, with active monitoring, users can set triggers based on specific parameters, so that when service levels drop to a pre-defined threshold and there is no change in that level for 60 seconds (i.e., the conditions are persistent), an alert can be delivered directly to a relevant application.
For example, alerts can be sent directly to MS Teams and Slack – two of the most popular business messaging and collaboration tools today. It means that administrators are alerted to conditions which may impact service quality in near-real-time through the app that they use the most for daily operations. Once an alert indication is received it can then be acted upon by the team. It is part of the overall service assurance framework that Emblasoft provides, enabling proactive troubleshooting.
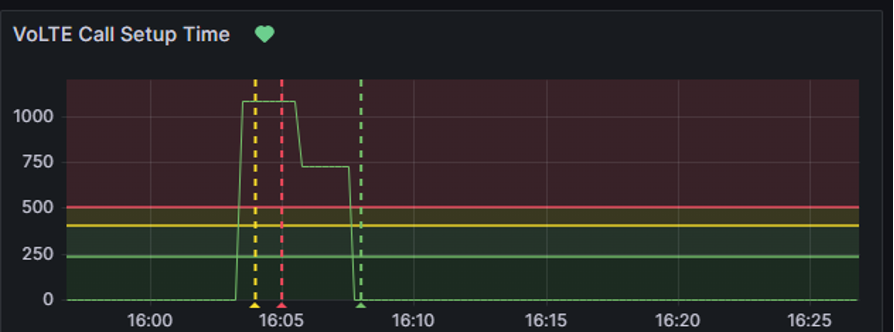
Figure 1. Active monitoring of VoLTE call setup time

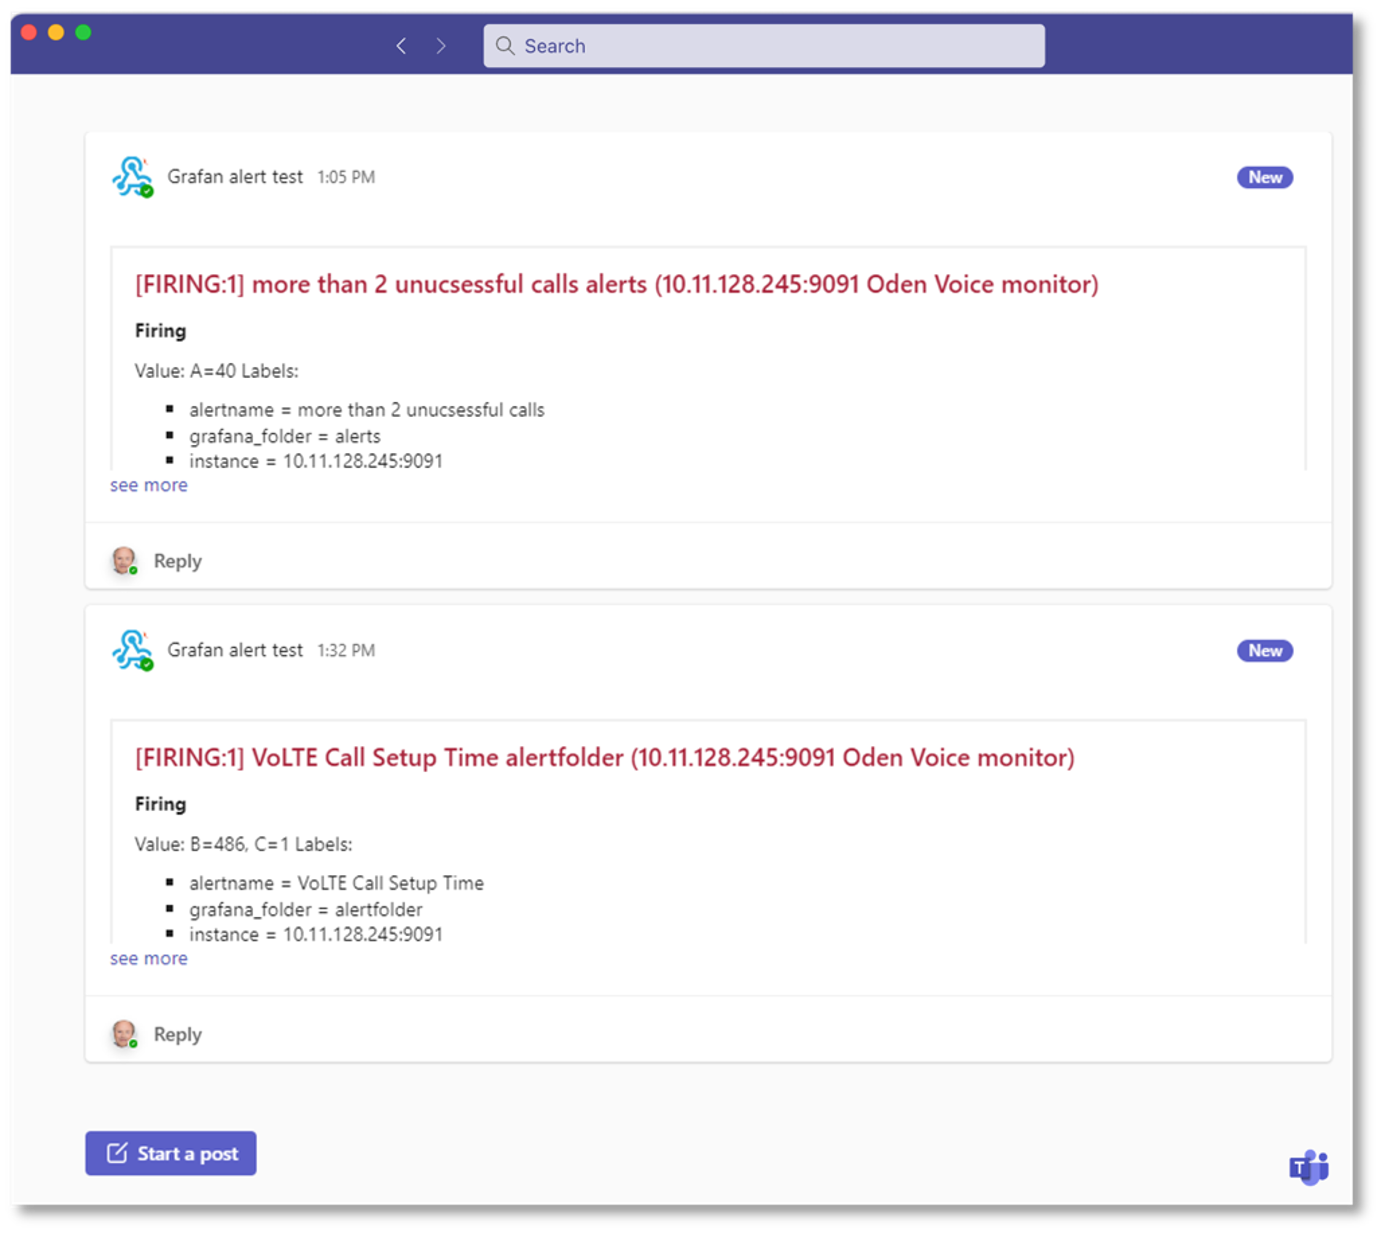
Figure 1, for example, shows an alert for VoLTE setup time. As shown, there is a surge in set up time (i.e., VoLTE set up times are too slow) at around 16.05pm. This peak passed the trigger threshold and lasted for 60 seconds, which resulted in an alert being sent to the MS Teams dashboard (see Figure 2).
Figure 2. An active monitoring alert sent to the MS Teams dashboard.

Active monitoring for MS Teams and Slack
As the two figures highlight, any test parameter can be set – both in an emulated environment for test and validation pre-launch, and in live networks throughout the service or slice lifecycle.
Once a certain threshold is met (for a pre-defined amount of time) it triggers an alert that is sent to an MS Teams or Slack dashboard. It means that administrators can be alerted to any issues during an automated series of pre-launch tests, or in live networks once the service or slice is active. In turn, issues can be fixed quickly before any drop in service levels impacts the end-user.
So, administrators can continue with daily operations safe in the knowledge that they will be instantly alerted to any service level issues. In turn, it allows them to quickly fix any issues and proactively assure service levels on a continual basis.
To find out more about Emblasoft Evolver, contact us today.